
 Over the past few months, I’ve written about how ratios and averages are great ways to add context to your data. Remember, data should be viewed over time to really understand what’s happening and always in the context of how the metrics relate to your community goals.
Building on these points, I wanted to write about the usefulness of data patterns. This topic recently came up for a friend who works on social media for a food company. Her team was looking for an easy way to understand how their audience was engaging with their social media efforts and they wanted one easy number to track the progress over time. Fair enough.
Sporadic Makes It Difficult To Track
Unfortunately, they started looking at their engagement on Facebook in terms of the number of comments on a post divided by its reach.
It’s great that they understood the need to use a ratio in order to understand whether 20 comments on a post, for example, was a good number or a bad number. However their ‘reach’ numbers were all over the map, which is a problem. (see graph below)
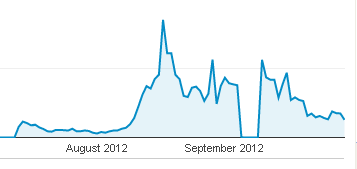
This Is Actual Data From Google Analytics Showing Sporadic Highs And Lows Making it Difficult To Use This As A Baseline.
When you have a situation where a measure, like reach, is sporadic and doesn’t conform to a pattern, then it’s difficult to use it as a way to track progress.
In this example, Facebook reach is being affected by the time of day an update is posted, whether the brand is running ads and the sharing of the update by followers.
If the brand posts a status update at peak Facebook time, they may reach 20,000 people. If posted at a quieter time, they may reach 500. So you can quickly see how 20 comments out of 20,000 could look really bad or 20 comments out of 500 could look really good.
Looking For A Pattern
Instead, what the brand should be doing is using metrics that follow a pattern.
But why? Isn’t reach really important?
Reach is definitely something marketing and advertising analytics are interested in. But if you’re looking to measure the progress of your community, then it will help to find pattern-based metrics that will help you quickly identify where a change has occurred.
Here is an example of pattern-based data. This type of pattern means that you can reliably test your content or activities. If data is sporadic and there is no pattern, you don’t know if an impact was caused by your activities or the time of day or something else beyond your control.

Here You Can See A Clear Pattern. This Is Real Web Data And Shows Weekly Peaks. This Type Of Pattern Is Helpful To Use As A Baseline For Progress Tracking.
The Value Of A Pattern In Your Data
Let’s say, for example, that you’re tracking the average number of comments made by members each week and the data looks something like this:
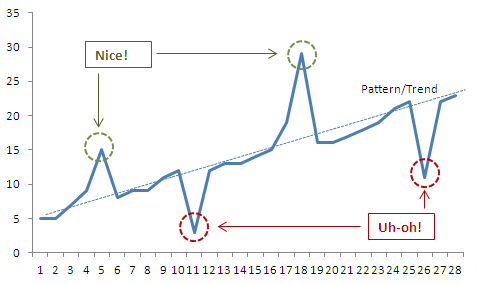
The Pattern or Trend Helps You Quickly See When Something Has Increased Your Data Or Caused A Decrease – So You Can Investigate The Cause Behind Each Change.
Here you can see that there’s a pattern to the data with a couple of peaks and some of dips. Because there’s there is this pattern, you can easily see four points worth investigating. Two of the points show peaks. Maybe you ran a contest that week or highlighted a particular subject that really resonated with your audience. Bingo – you’ve found some areas that your community likes to talk about. Then there were some dips. The first one might have been a technical outage so nothing to worry about there. The second was during a week-long book review and so maybe that’s something that people don’t engage with or comment on.
The food company should look at using more pattern-based metrics like the ratio of comments over total number of members. Using this metric and some A/B Testing, the community manager could work out if the type of post is causing more comments or perhaps it’s the time of day.
Alternatively, the brand could try to find a time when the reach is consistent – say every Tuesday at 10am. By doing that, they’re turning their reach metric into a pattern and can start to use it more reliably to track engagement.
Patterns = Reliable Baselines
The net-net is that it’s difficult to reliably track your community progress if you’re using metrics that are sporadic and shifting due to factors beyond your control. It makes it incredibly difficult to know if it’s your actions that are causing a change in behavior or if it’s something else.
The way to get around this issue is to use metrics and data that follows a pattern. The pattern works like an average and allows you to quickly see when something has drastically changed and alerts you to potential areas to investigate. Patterns also give you a long- term view of how your community is changing over time. Perhaps the average number of comments each week is slowly decreasing or maybe the average time in your community is starting to increase after being flat for a few months.
The good news is that just by expanding your Google Analytics or constructing a few charts in excel, you will start to see whether a line of data (like the average time of site each day for example) has a reliable pattern that you can use to track your progress. As you’re defining what ratios you want to measure on a regular basis to help you track the health of your community over time, look out for data that has a pattern that will allow you to easily notice when the metrics are changing. This way, you can investigate and take action to keep your community thriving.
Good luck and, as always, feel free to drop me a note in the comments or on Twitter (@chrisdowsett) if you have any questions.

Chris Dowsett (or Dows for short) is your friendly data analyst, statistician and numbers person. Originally from Australia, Chris works for Intuit as a social media analytics manager. He’s also studying a Doctorate focused on improving data use in business decision making.
You mention FB, but FB is literally throttling down what pages get reach and how much reach they get, so is your data backed up by these changes?
DouglasCrets Good question, thanks Doug. We’ve been looking at how Facebook is changing its reach calculations and we’ve found it still not a reliable (pattern-based) metric overall. The fact that Facebook changes its reach calculations speaks to my point about look for pattern-based metrics to understand where your community or audience engagement for example are getting better or in need of improvement. When elements outside your control change sporadically, like Facebook changing its algorithms, it makes it difficult to pinpoint whether your community is changing or if it’s just the measurement tool that’s changing. Hope that helps, Chris
aaa
hm..
Bello!